Cylindrical Coordinate Matching
Aim of task
- Student knows the transformation from cartesian to cylindrical coordinates (Handling mathematical symbols and formalism)
- Studen adapts his understanding of the 3D-space to a novel set of coordinates with help of a visualization (making use of aids and tools)
- Student can take a volume with cylindrical geometry and reconstruct the limits of its parameters (represent mathematical entities, posing and solving mathematical problems, making use of aids and tools )
 |
|---|
| First impression of the question |
Question description
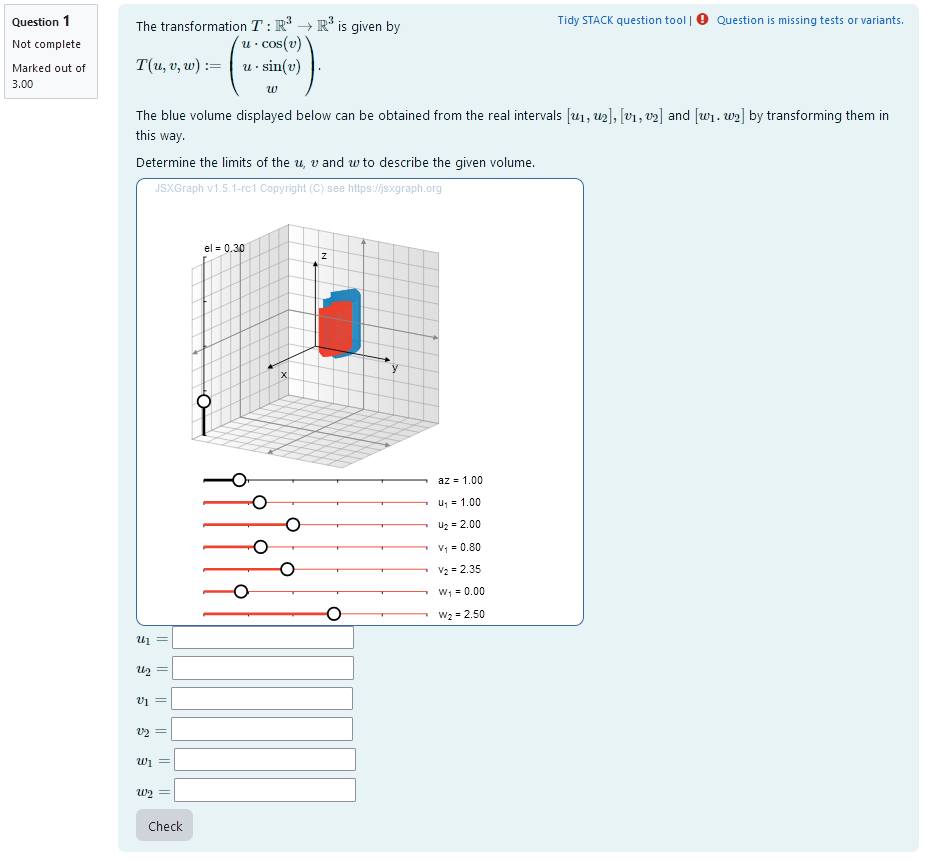
A 3D volume with cylindrical geometry is plotted. It is a randomly generated section of a volume expressed as a parametrization of $u$,$v$ and $w$. An additional 3D section of the same geometry is plotted that can be varied using sliders. That way, by matching the two volumes, the intervalls can be interactively obtained. The task is to find the correct intervalls for $u$, $v$ and $w$ in real numbers that construct the generated volume. This task is a modification/ application of the task General Coordinate Transformation Matching.
Student perspective
The student sees a cartesian coordinate system and a volume cylindrical geometry.
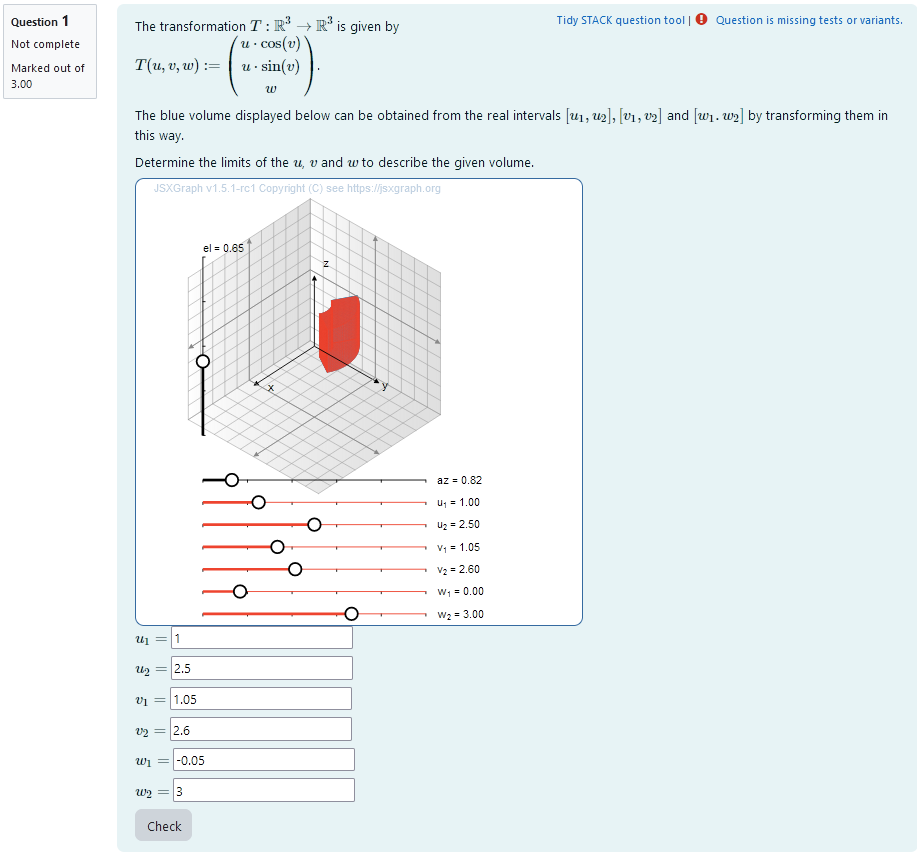
It is the task to reconstruct the intervals of a 3D integration in the new coordinates that results in the volume given. In order to do this they have to find out the correct values by matching a second volume to the given one using sliders.
 |
|---|
| When the student solves the problem |
Teacher perspective
The teacher is able to give a transformation iwth the functions Tx,Ty and Tz given as a parametrization of the cartesian $x$,$y$ and $z$ using new parameters $u$, $v$ and $w$. The function needs to be expressed in Maxima/STACK syntax.
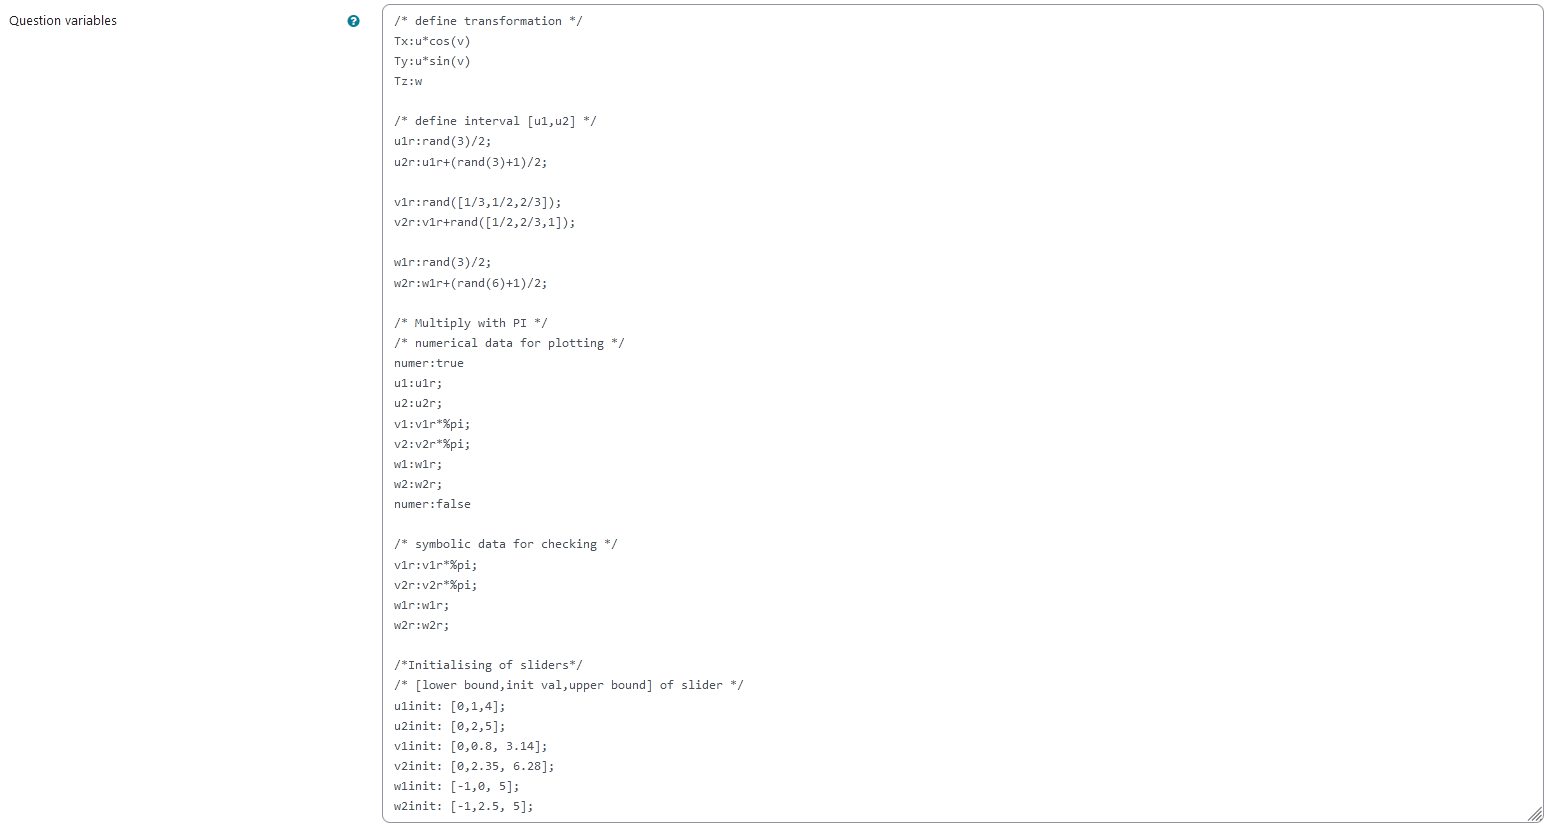
The teacher can provide a list of possible values for interval bounds. In order to do this, they simply need to modify the entries in the lists specified e.g. change v1r:rand([1/6,1/3,1/2]); to v1r:rand([1/8,1/7,1/3]);. However, the maximal intervals are dependent on the transformation chosen.
For an explanation of the processing of the values read Question variables and Question text.
 |
|---|
| The above image shows which values the teacher may wish to change |
Question code
Question Variables
- The transformation function
Tx,Ty, andTzare defined v1r,v2r,w1r,w2rtake random values of a list containing possible values (needs to be multiplied by pi later)u1randu2rare randomly selected in steps of 1/2 andu2ris always bigger thanu1r+v1r,v2r,w1r,w2rare multiplied by pi and saved as numerical values. This is done in betweennumer:trueandnumer:false.- the values for the sliders are initialized to facilitate changing them depending on the transformation
Question variable code
/* define transformation */
Tx:u*cos(v)
Ty:u*sin(v)
Tz:w

/* define interval [u1,u2] */
u1r:rand(3)/2;
u2r:u1r+(rand(3)+1)/2;

v1r:rand([1/3,1/2,2/3]);
v2r:v1r+rand([1/2,2/3,1]);

w1r:rand(3)/2;
w2r:w1r+(rand(6)+1)/2;

/* Multiply with PI */
/* numerical data for plotting */
numer:true
u1:u1r;
u2:u2r;
v1:v1r*%pi;
v2:v2r*%pi;
w1:w1r;
w2:w2r;
numer:false

/* symbolic data for checking */
v1r:v1r*%pi;
v2r:v2r*%pi;
w1r:w1r;
w2r:w2r;

/*Initialising of sliders*/
/* [lower bound,init val,upper bound] of slider */
u1init: [0,1,4];
u2init: [0,2,5];
v1init: [0,0.8, 3.14];
v2init: [0,2.35, 6.28];
w1init: [-1,0, 5];
w2init: [-1,2.5, 5];
Question Text
- “The transformation $T:\mathbb{R}^3\to\mathbb{R}^3$ is given by
T(u,v,w):= \begin{pmatrix} Tx \\ Ty \\ Tz \end{pmatrix}.
The blue volume displayed below can be obtained from the real intervals ([u_1,u_2], [v_1,v_2]) and ([w_1.w_2]) by transforming them in this way.
Determine the limits of the (u), (v) and (w) to describe the given volume. “
- Task explanation using LaTex
- JSXGraph applet using the functions and variables defined in Question variables plotting the 3D volume given by the coordinates
u,vandr [[input:ans1]],[[input:ans2]],[[input:ans3]],[[input:ans4]],[[input:ans5]],[[input:ans6]]at the end of JSXGraph code to allow input of answers of the student foru,vandwrespectively[[validation:ans1]],[[validation:ans2]],[[validation:ans3]],[[validation:ans4]],[[validation:ans5]],[[validation:ans6]]checking of answer
Question text code
<p>The transformation \(T:\mathbb{R}^3\to\mathbb{R}^3\) is given by<br>
\( T(u,v,w):= \begin{pmatrix} {@Tx@} \\ {@Ty@} \\ {@Tz@}\end{pmatrix} \).</p>
<p>The blue volume displayed below can be obtained from the real intervals \([u_1,u_2], [v_1,v_2]\) and \([w_1.w_2]\) by transforming them in this way.</p>
<p>Determine the limits of the \(u\), \(v\) and \(w\) to describe the given volume. </p>


[[jsxgraph width="500px" height="500px"  input-ref-ans1='ans1Ref' input-ref-ans2='ans2Ref' input-ref-ans3='ans3Ref' input-ref-ans4='ans4Ref' input-ref-ans5='ans5Ref' input-ref-ans6='ans6Ref']]
var board = JXG.JSXGraph.initBoard(divid,{boundingbox : [-10, 10, 10,-10], axis:false, shownavigation : false});

var box = [-5,5];
var view = board.create('view3d',
		        [[-6, -1.5], [8, 8],
		        [box, box, box]],
		        {});

			// Transform components of the vector function


		                       var TF1 = board.jc.snippet('{#Tx#}', true, 'u,v,w');
		                       var TF2 = board.jc.snippet('{#Ty#}', true, 'u,v,w');
		                       var TF3 = board.jc.snippet('{#Tz#}', true, 'u,v,w');

                 var u1 = {#u1#};
		    var u2 = {#u2#};
		    var v1 = {#v1#};
		    var v2 = {#v2#};
		    var w1 = {#w1#};
		    var w2 = {#w2#};

		    var u1init = {#u1init#};
		    var u2init = {#u2init#};
		    var v1init = {#v1init#};
		    var v2init =  {#v2init#};
		    var w1init =  {#w1init#};
		    var w2init =  {#w2init#};

	    // Create Slider for control object for student
            var u1s = board.create('slider', [[-7, -4.5], [3, -4.5], u1init], { name: 'u_1',snapwidth:0.05, highline: {strokeColor: '#EE442F'}, baseline: {strokeColor: '#EE442F'}});
            var u2s = board.create('slider', [[-7, -5.5], [3, -5.5], u2init], { name: 'u_2',snapwidth:0.05, highline: {strokeColor: '#EE442F'}, baseline: {strokeColor: '#EE442F'}});
            var v1s = board.create('slider', [[-7, -6.5], [3, -6.5], v1init], { name: 'v_1',snapwidth:0.05, highline: {strokeColor: '#EE442F'}, baseline: {strokeColor: '#EE442F'}});
            var v2s = board.create('slider', [[-7, -7.5], [3, -7.5], v2init], { name: 'v_2',snapwidth:0.05, highline: {strokeColor: '#EE442F'}, baseline: {strokeColor: '#EE442F'}});
            var w1s = board.create('slider', [[-7, -8.5], [3, -8.5], w1init], { name: 'w_1',snapwidth:0.05, highline: {strokeColor: '#EE442F'}, baseline: {strokeColor: '#EE442F'}});
            var w2s = board.create('slider', [[-7, -9.5], [3, -9.5], w2init], { name: 'w_2',snapwidth:0.05, highline: {strokeColor: '#EE442F'}, baseline: {strokeColor: '#EE442F'}});

/* stack_jxg.define_group([u1s,u2s,v1s,v2s,w1s,w2s]);*/

				// Create transformed box
		    var c1 = view.create('parametricsurface3d', [
		        (u, v) => TF1(u,v,w1),
		        (u, v) => TF2(u,v,w1),
		        (u, v) => TF3(u,v,w1),
		        () => [u1, u2],
		        () => [v1, v2]
		        ], { strokeColor: "#1f84bc",strokeWidth: 1, strokeOpacity: 0.6,
					mesh3d: { visible: true }});

		    var c2 = view.create('parametricsurface3d', [
		        (u, v) => TF1(u,v,w2),
		        (u, v) => TF2(u,v,w2),
		        (u, v) => TF3(u,v,w2),
		        () => [u1, u2],
		        () => [v1, v2]
		        ], { strokeColor: "#1f84bc",strokeWidth: 1, strokeOpacity: 0.6,
					mesh3d: { visible: false } });

		    var c3 = view.create('parametricsurface3d', [
		        (u, w) => TF1(u,v1,w),
		        (u, w) => TF2(u,v1,w),
		        (u, w) => TF3(u,v1,w),
		        () => [u1, u2],
		        () => [w1, w2]
		        ], { strokeColor: "#1f84bc",strokeWidth: 1, strokeOpacity: 0.6,
					mesh3d: { visible: false } });

			var c4 = view.create('parametricsurface3d', [
		        (u, w) => TF1(u,v2,w),
		        (u, w) => TF2(u,v2,w),
		        (u, w) => TF3(u,v2,w),
		        () => [u1, u2],
		        () => [w1, w2]
		        ], { strokeColor: "#1f84bc",strokeWidth: 1, strokeOpacity: 0.6, mesh3d: { visible: false } });

			var c5 = view.create('parametricsurface3d', [
		        (v, w) => TF1(u1,v,w),
		        (v, w) => TF2(u1,v,w),
		        (v, w) => TF3(u1,v,w),
		        () => [v1, v2],
		        () => [w1, w2]
		        ], { strokeColor: "#1f84bc",strokeWidth: 1, strokeOpacity: 0.6, mesh3d: { visible: false } });

			var c6 = view.create('parametricsurface3d', [
		        (v, w) => TF1(u2,v,w),
		        (v, w) => TF2(u2,v,w),
		        (v, w) => TF3(u2,v,w),
		        () => [v1, v2],
		        () => [w1, w2]
		        ], { strokeColor: "#1f84bc",strokeWidth: 1, strokeOpacity: 0.6, mesh3d: { visible: false } });


		    // Create transformed box - student

		    var c1s = view.create('parametricsurface3d', [
		        (u, v) => TF1(u,v,w1s.Value()),
		        (u, v) => TF2(u,v,w1s.Value()),
		        (u, v) => TF3(u,v,w1s.Value()),
		        () => [u1s.Value(), u2s.Value()],
		        () => [v1s.Value(), v2s.Value()]
		        ], {strokeColor: "#EE442F",
                    strokeWidth: 1, strokeOpacity: 0.6, mesh3d: { visible: true } });

		    var c2s = view.create('parametricsurface3d', [
		        (u, v) => TF1(u,v,w2s.Value()),
		        (u, v) => TF2(u,v,w2s.Value()),
		        (u, v) => TF3(u,v,w2s.Value()),
		        () => [u1s.Value(), u2s.Value()],
		        () => [v1s.Value(), v2s.Value()]
		        ], {strokeColor: "#EE442F",
                    strokeWidth: 1, strokeOpacity: 0.6, mesh3d: { visible: false } });

		    var c3s = view.create('parametricsurface3d', [
		        (u, w) => TF1(u,v1s.Value(),w),
		        (u, w) => TF2(u,v1s.Value(),w),
		        (u, w) => TF3(u,v1s.Value(),w),
		        () => [u1s.Value(), u2s.Value()],
		        () => [w1s.Value(), w2s.Value()]
		        ], { strokeColor: "#EE442F",
                    strokeWidth: 1, strokeOpacity: 0.6, mesh3d: { visible: false } });

			var c4s = view.create('parametricsurface3d', [
		        (u, w) => TF1(u,v2s.Value(),w),
		        (u, w) => TF2(u,v2s.Value(),w),
		        (u, w) => TF3(u,v2s.Value(),w),
		        () => [u1s.Value(), u2s.Value()],
		        () => [w1s.Value(), w2s.Value()]
		        ], { strokeColor: "#EE442F",
                    strokeWidth: 1, strokeOpacity: 0.6, mesh3d: { visible: false } });

			var c5s = view.create('parametricsurface3d', [
		        (v, w) => TF1(u1s.Value(),v,w),
		        (v, w) => TF2(u1s.Value(),v,w),
		        (v, w) => TF3(u1s.Value(),v,w),
		        () => [v1s.Value(), v2s.Value()],
		        () => [w1s.Value(), w2s.Value()]
		        ], {strokeColor: "#EE442F",
                    strokeWidth: 1, strokeOpacity: 0.6, mesh3d: { visible: false } });

			var c6s = view.create('parametricsurface3d', [
		        (v, w) => TF1(u2s.Value(),v,w),
		        (v, w) => TF2(u2s.Value(),v,w),
		        (v, w) => TF3(u2s.Value(),v,w),
		        () => [v1s.Value(), v2s.Value()],
		        () => [w1s.Value(), w2s.Value()]
		        ], { strokeColor: "#EE442F",
                    strokeWidth: 1, strokeOpacity: 0.6, mesh3d: { visible: false } });

		        stack_jxg.bind_slider(ans1Ref,u1s);
			stack_jxg.bind_slider(ans2Ref,u2s);
			stack_jxg.bind_slider(ans3Ref,v1s);
			stack_jxg.bind_slider(ans4Ref,v2s);
			stack_jxg.bind_slider(ans5Ref,w1s);
			stack_jxg.bind_slider(ans6Ref,w2s);

/* axis labels*/
                       var xlabel=view.create('point3d',[0.9*box[1],0,(0.6*box[0]+0.4*box[1])], {size:0,name:"x"});
                       var ylabel=view.create('point3d',[0,0.9*box[1],(0.6*box[0]+0.4*box[1])], {size:0,name:"y"});
                       var zlabel=view.create('point3d',[
                           0.7*(0.6*box[0]+0.4*box[1]),
                           0.7*(0.6*box[0]+0.4*box[1]),
                           0.9*box[1]],
                           {size:0,name:"z"});
			board.update();
[[/jsxgraph]]
<p>\(u_1=\) [[input:ans1]] [[validation:ans1]]</p>
<p>\(u_2=\) [[input:ans2]] [[validation:ans2]]</p>
<p>\(v_1 =\) [[input:ans3]] [[validation:ans3]]</p>
<p>\(v_2 =\) [[input:ans4]] [[validation:ans4]]</p>
<p>\(w_1=\)  [[input:ans5]] [[validation:ans5]]</p>
<p>\(w_2=\)  [[input:ans6]] [[validation:ans6]]</p>
Answers
Answer ans 1
|property | setting|
|:—|:—|
|Input type | Numerical|
|Model answer | u1r defined in Question variables |
| Forbidden words | none |
| Forbid float | No |
| Student must verify | Yes |
| Show the validation | Yes, with variable list|
—
Answer ans 2
|property | setting|
|:—|:—|
|Input type | Numerical|
|Model answer | u2r defined in Question variables |
| Forbidden words | none |
| Forbid float | No |
| Student must verify | Yes |
| Show the validation | Yes, with variable list|
—
Answer ans 3
|property | setting|
|:—|:—|
|Input type | Numerical|
|Model answer | v1r defined in Question variables |
| Forbidden words | none |
| Forbid float | No |
| Student must verify | Yes |
| Show the validation | Yes, with variable list|
Answer ans 4
|property | setting|
|:—|:—|
|Input type | Numerical|
|Model answer | v2r defined in Question variables |
| Forbidden words | none |
| Forbid float | No |
| Student must verify | Yes |
| Show the validation | Yes, with variable list|
—
Answer ans 5
|property | setting|
|:—|:—|
|Input type | Numerical|
|Model answer | w1r defined in Question variables |
| Forbidden words | none |
| Forbid float | No |
| Student must verify | Yes |
| Show the validation | Yes, with variable list|
—
Answer ans 6
|property | setting|
|:—|:—|
|Input type | Numerical|
|Model answer | w2r defined in Question variables |
| Forbidden words | none |
| Forbid float | No |
| Student must verify | Yes |
| Show the validation | Yes, with variable list|
Potential response tree
prt1
Feedback variables:
u1s:ans1
u2s:ans2
 |
|---|
| Visualization of prt1 |
Node 1
| property | setting |
|---|---|
| Answer Test | NumAbsolute |
| SAns | u1s |
| TAns | u1r |
| Node 1 true feedback | <p>Nice, you found the correct value for \(u_1\)! Good job!</p> |
| Node 1 false feedback | <p>The value you gave for \(u_1\) is not correct. </p> |
 |
|---|
| Values of node 1 |
Node 2
| property | setting |
|---|---|
| Answer Test | NumAbsolute |
| SAns | u2s |
| TAns | u2r |
| Node 2 true feedback | <p>Nice, you found the correct value for \(u_2\)! Good job!</p> <p> Perfect! You got both values right! </p> |
| Node 2 false feedback | <p>The value you gave for \(u_2\) is not correct. Try matching the volumes perfectly.</p> |
 |
|---|
| Values of node 2 |
Node 3
| property | setting |
|---|---|
| Answer Test | NumAbsolute |
| SAns | u2s |
| TAns | u2r |
| Node 3 true feedback | <p>Nice, you found the correct value for \(u_2\)! Good job!</p> <p>Check whether you did anything different here than for \(u_1\) and try again. </p> |
| Node 3 false feedback | <p>The value you gave for \(u_2\) is also not correct. Try matching the volumes perfectly by adjusting the sliders. \(u_1,u_2\) define the radial component. </p> |
 |
|---|
| Values of node 3 |
prt2
Feedback variables:
v1s:ans3;
v2s:ans4;
 |
|---|
| Visualization of prt2 |
Node 1
| property | setting |
|---|---|
| Answer Test | NumAbsolute |
| SAns | v1s |
| TAns | v1r |
| Node 1 true feedback | <p>Nice, you found the correct value for \(v_1\)! Good job!<p> |
| Node 1 false feedback | <p>The value you gave for \(v_1\) is not correct. </p> |
 |
|---|
| Values of node 1 |
Node 2
| property | setting |
|---|---|
| Answer Test | NumAbsolute |
| SAns | v2s |
| TAns | v2r |
| Node 2 true feedback | <p>Nice, you found the correct value for \(v_2\)! Good job!</p> <p> Perfect! You got both values right! </p> |
| Node 2 false feedback | <p>The value you gave for \(v_2\) is not correct. Try matching the volumes perfectly.</p> |
 |
|---|
| Values of node 2 |
Node 3
| property | setting |
|---|---|
| Answer Test | NumAbsolute |
| SAns | v2s |
| TAns | v2r |
| Node 3 true feedback | <p>Nice, you found the correct value for \(v_2\)! Good job!</p> <p>Check whether you did anything different here than for \(v_1\) and try again. </p> |
| Node 3 false feedback | <p>The value you gave for \(v_2\) is also not correct. Try matching the volumes perfectly. \(v_1,v_2\) define the opening angle of the radial component.</p> |
 |
|---|
| Values of node 3 |
prt3
Feedback variables:
w1s:ans5;
w2s:ans6;
 |
|---|
| Visualization of prt3 |
Node 1
| property | setting |
|---|---|
| Answer Test | NumAbsolute |
| SAns | w1s |
| TAns | w1r |
| Node 1 true feedback | <p>Nice, you found the correct value for \(w_1\)! Good job!<p> |
| Node 1 false feedback | <p>The value you gave for \(w_1\) is not correct. </p> |
 |
|---|
| Values of node 1 |
Node 2
| property | setting |
|---|---|
| Answer Test | NumAbsolute |
| SAns | w2s |
| TAns | w2r |
| Node 2 true feedback | <p>Nice, you found the correct value for \(w_2\)! Good job!</p> <p> Perfect! You got both values right! </p> |
| Node 2 false feedback | <p>The value you gave for \(w_2\) is not correct. Try matching the volumes perfectly. </p> |
 |
|---|
| Values of node 2 |
Node 3
| property | setting |
|---|---|
| Answer Test | NumAbsolute |
| SAns | w2s |
| TAns | w2r |
| Node 3 true feedback | <p>Nice, you found the correct value for \(w_2\)! Good job!</p> <p>Check whether you did anything different here than for \(w_1\) and try again. </p> |
| Node 3 false feedback | <p>The value you gave for \(w_2\) is also not correct. Try matching the volumes perfectly. \(w_1,w_2\) define the opening angle in the \(x-y\)-plane.</p> |
 |
|---|
| Values of node 3 |