Parametric surfaces and graphs
Aim of task
- Student knows multidimensional functions are stated (Handling mathematical symbols and formalism)
- Student knows how special 2D functions look like (Representing mathematical entities)
- Using a visualization of multidimensional functions they reconstruct the given function (Making use of aids and tools)
 |
|---|
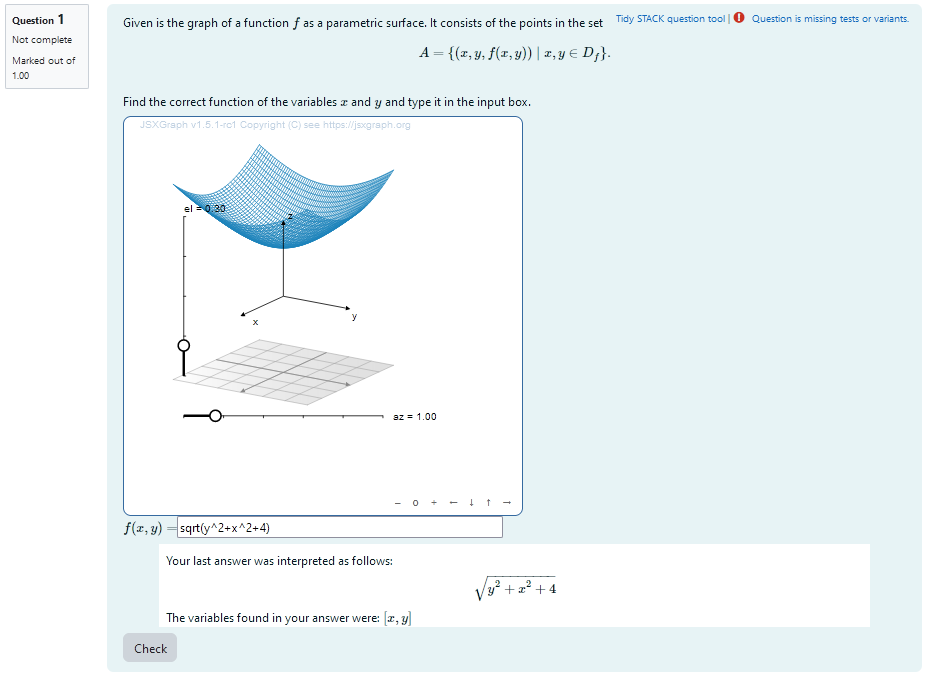
| First impression of the question |
Question description
A 2D function $f$ is plotted resulting in a surface embedded in 3D. This surface is the graph og the function an contains the points in the set $A= {(x,y,f(x,y))\mid x,y \in D_f }$. It is the task of the students to find a parametrisation of this surface or put differently: to reconstruct $f$. They will be provided with graphical feedback to help them solving problems with their inital ideas.
Student perspective
A JSXGraph applet containing the plot is displayed. The students can rotate the plot and look at it from different perspectives and then give their answer as an algebraic expression.
 |
|---|
| When the student solves the problem |
Teacher perspective
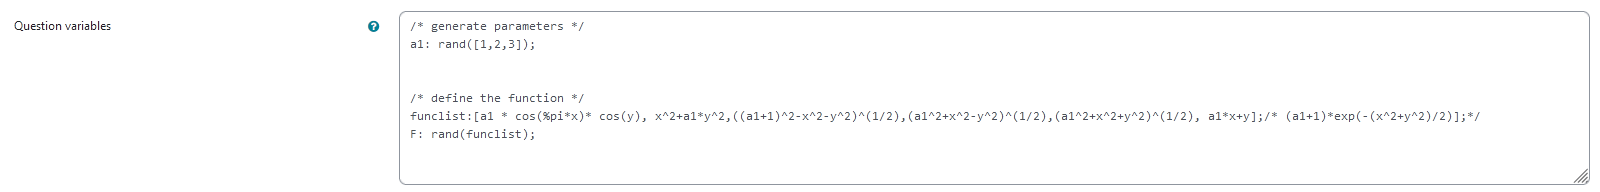
The teacher is able to give a list of possible values for parameters of the function. In order to alter them, they simply need to modify the entries in the lists specified e.g. change a1: rand([1,2,3]); to a1:rand([2,3,4,5,6,7,8])/5;.
Furthermore the teacher is give a list of possible functions from which the task is randomized.
The current list is funclist:[a1 * cos(%pi*x)* cos(y), x^2+a1*y^2,((a1+1)^2-x^2-y^2)^(1/2),(a1^2+x^2-y^2)^(1/2),(a1^2+x^2+y^2)^(1/2), a1*x+y];
However, it might be necessary to define additional parameters analogous to the ones defined before.
 |
|---|
| The above image shows which values the teacher may wish to change |
Question code
Question Variables
- An integer number à1
is selected randomly -
a list of functions with parameters ` a1
dependent on variablesx,y` is given:funclist:[a1 * cos(%pi*x)* cos(y), x^2+a1*y^2,((a1+1)^2-x^2-y^2)^(1/2),(a1^2+x^2-y^2)^(1/2),(a1^2+x^2+y^2)^(1/2), a1*x+y]; -
a function is randomly selected from the list:
F: rand(funclist);
Question variable code
/* generate parameters */
a1: rand([1,2,3]);


/* define the function */
funclist:[a1 * cos(%pi*x)* cos(y), x^2+a1*y^2,((a1+1)^2-x^2-y^2)^(1/2),(a1^2+x^2-y^2)^(1/2),(a1^2+x^2+y^2)^(1/2), a1*x+y];/* (a1+1)*exp(-(x^2+y^2)/2)];*/
F: rand(funclist);
Note, that an additional function is commented out. This is because there seems to be some problem with the exponential function. Feel free to try and include it.
Question Text
- “Given is the graph of a function $f$ as a parametric surface. It consists of the points in the set $A= {(x,y,f(x,y))\mid x,y \in D_f } .$
Find the correct function of the variables $x$ and $y$ and type it in the input box. ” - JSXGraph applet using the functions and variables defined in Question variables plotting the randomized function
[[input:ans1]]at the end of JSXGraph code to allow input of an answer of the student[[validation:ans1]]checking of answer
Question text code
<p>Given is the graph of a function \(f\) as a parametric surface. It consists of the points in the set \[A= \{(x,y,f(x,y))\mid x,y \in D_f \} .\]<br>
Find the correct function of the variables \(x\) and \(y\) and type it in the input box. </p>


[[jsxgraph width="500px" height="500px" input-ref-ans1='ans1Ref']]
var board = JXG.JSXGraph.initBoard(divid,{boundingbox : [-10, 10, 10,-10], axis:false, shownavigation : true});

	    var box = [-3, 3];
		    var view = board.create('view3d',
		        [
		            [-6, -3], [8, 8],
		            [box, box, box]
		        ],
		        {
		            xPlaneRear: {visible: false},
		            xPlaneRearYAxis: {visible: false},
		            xPlaneRearZAxis: {visible: false},
		            yPlaneRear: {visible: false},
		            yPlaneRearXAxis: {visible: false},
		            yPlaneRearZAxis: {visible: false},
		        });

                               var txtraw = '{#F#}';
                               txtraw=txtraw.replace(/%pi/g, "PI");
                              txtraw=txtraw.replace(/%exp/g,"Math.exp");
                              var F =  board.jc.snippet(txtraw, true, 'x,y');


    var c = view.create('functiongraph3d', [
        F,
        box,
        box,
    ], { strokeWidth: 1, strokeColor: "#1f84bc", stepU: 70, stepsV: 70 });


board.update();


/* axis labels*/
                       var xlabel=view.create('point3d',[0.9*box[1],0,(0.6*box[0]+0.4*box[1])], {size:0,name:"x"});
                       var ylabel=view.create('point3d',[0,0.9*box[1],(0.6*box[0]+0.4*box[1])], {size:0,name:"y"});
                       var zlabel=view.create('point3d',[
                           0.7*(0.6*box[0]+0.4*box[1]),
                           0.7*(0.6*box[0]+0.4*box[1]),
                           0.9*box[1]],
                           {size:0,name:"z"});

[[/jsxgraph]]
<p>\(f(x,y)=\)[[input:ans1]] </p><p>[[validation:ans1]]</p>
Answers
Answer ans 1
|property | setting|
|:—|:—|
|Input type | Algebraic Input |
|Model answer | F defined in Question variables |
| Forbidden words | none |
| Forbid float | Yes |
| Student must verify | Yes |
| Show the validation | Yes, with variable list|
—
Potential response tree
prt1
 |
|---|
| Visualization of prt1 |
|  |
|:–:|
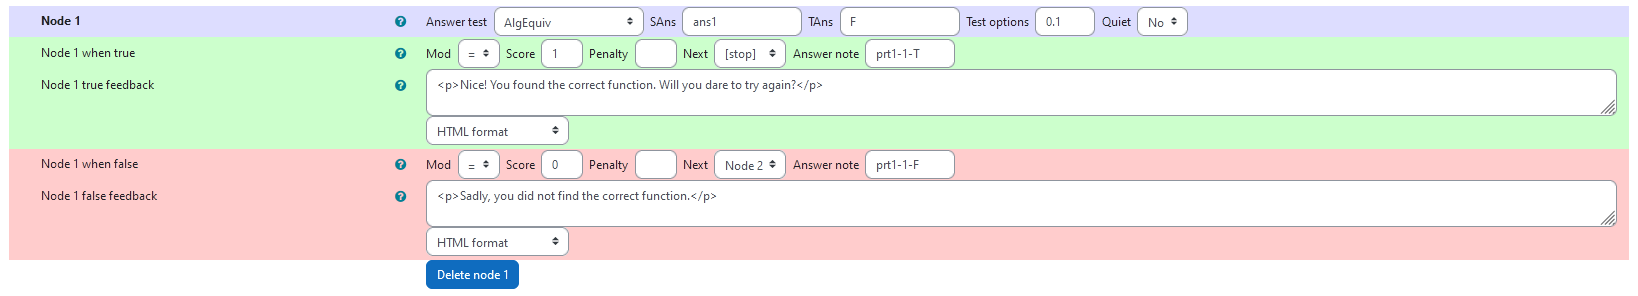
| Values of node 1 |
|
|:–:|
| Values of node 1 |
Node 1
|property | setting|
|:—|:—|
|Answer Test | AlgEquiv|
|SAns | ans1|
|TAns | F|
|Node 1 true feedback | <p>Nice! You found the correct function. Will you dare to try again?</p>|
|Node 1 false feedback | <p>Sadly, you did not find the correct function.</p>|
 |
|---|
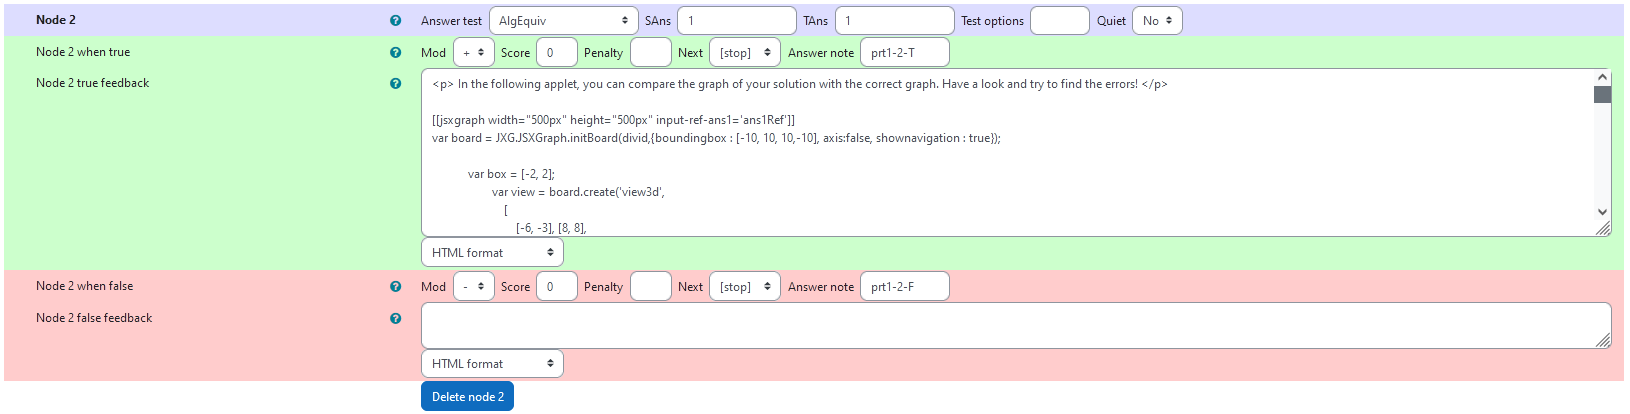
| Values of node 2 |
Node 2
|property | setting|
|:—|:—|
|Answer Test | AlgEquiv|
|SAns | 1|
|TAns | 1|
|Node 2 true feedback | <p> In the following applet, you can compare the graph of your solution with the correct graph. Have a look and try to find the errors! </p> and the following JSXGraph applet|
|Node 2 false feedback | ` `|
Graphical feedback code
<p> In the following applet, you can compare the graph of your solution with the correct graph. Have a look and try to find the errors! </p>

[[jsxgraph width="500px" height="500px" input-ref-ans1='ans1Ref']]
var board = JXG.JSXGraph.initBoard(divid,{boundingbox : [-10, 10, 10,-10], axis:false, shownavigation : true});

	    var box = [-2, 2];
		    var view = board.create('view3d',
		        [
		            [-6, -3], [8, 8],
		            [box, box, box]
		        ],
		        {
		            xPlaneRear: {visible: false},
		            xPlaneRearYAxis: {visible: false},
		            xPlaneRearZAxis: {visible: false},
		            yPlaneRear: {visible: false},
		            yPlaneRearXAxis: {visible: false},
		            yPlaneRearZAxis: {visible: false},
		        });

                               var txtraw = '{#F#}';
                               txtraw=txtraw.replace(/%pi/g, "PI");
txtraw=txtraw.replace(/%exp/g,"Math.exp");
                              var F =  board.jc.snippet(txtraw, true, 'x,y');

                              var txtraw = '{#ans1#}';
                               txtraw=txtraw.replace(/%pi/g, "PI");
txtraw=txtraw.replace(/%exp/g,"Math.exp");
                              var F_student =  board.jc.snippet(txtraw, true, 'x,y');


    var c = view.create('functiongraph3d', [
        F,
        box,
        box,
    ], { strokeWidth: 1, strokeColor: '#1f84bc', stepU: 70, stepsV: 70 });

  var c_student = view.create('functiongraph3d', [
        F_student,
        box,
        box,
    ], { strokeWidth: 1, strokeColor: '#EE442F', stepU: 70, stepsV: 70 });

board.update();


/* axis labels*/
                       var xlabel=view.create('point3d',[0.9*box[1],0,(0.6*box[0]+0.4*box[1])], {size:0,name:"x"});
                       var ylabel=view.create('point3d',[0,0.9*box[1],(0.6*box[0]+0.4*box[1])], {size:0,name:"y"});
                       var zlabel=view.create('point3d',[
                           0.7*(0.6*box[0]+0.4*box[1]),
                           0.7*(0.6*box[0]+0.4*box[1]),
                           0.9*box[1]],
                           {size:0,name:"z"});

[[/jsxgraph]]
| 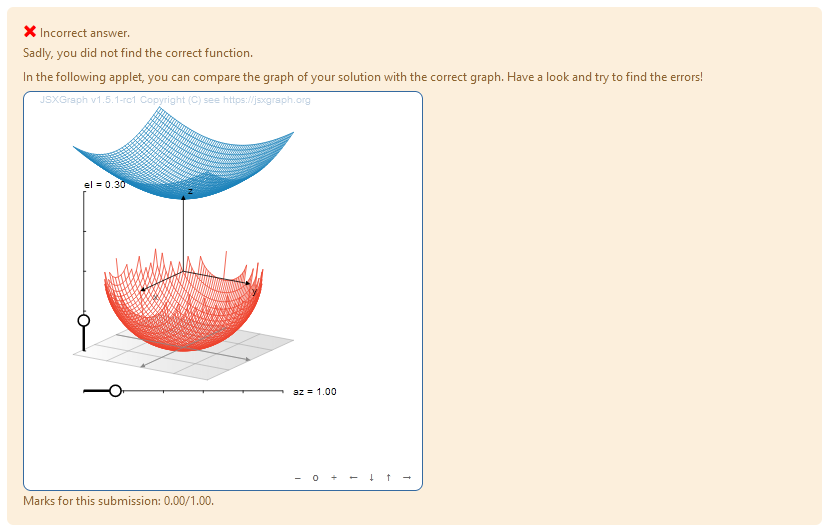 |
|:–:|
| Graphical feedback |
|
|:–:|
| Graphical feedback |